
Extracellular control of chromosomal instability and maintenance of intra-tumoral heterogeneity

Abstract
Aim: Current cancer treatments are challenged by the plasticity of cancer cells, largely influenced by chromosomal instability (CIN) leading to variations in karyotype known as tumor-specific aneuploidy, which in turn, leads to intra-tumor cellular heterogeneity (TH). Cells with certain chromosomal defects often survive treatment and the growth-associated states of TH persist in recurrent tumors. Modulation of the CIN rate seems to reside within the tumor itself. In an attempt to develop a therapy targeting cancer plasticity, we studied the possible extracellular control of CIN rate in Chr7-defined TH in gliomas.
Methods: Chr7-fluorescence in situ hybridization was applied on various grades of gliomas, in vitro cultures and intracranial xenografts of two syngeneic glioma lines (U251 and U251-NS) derived from various cell-inoculating densities, with or without EFEMP1 overexpression.
Results: A grade-dependent increase of trisomy-7 population and Chr7-defined cell diversity was shown in gliomas. A negative association between Chr7-MS rate and initial cell-inoculating density was observed which was prevented by EFEMP1 overexpression.
Conclusion: Our data demonstrate that CIN is a major driver for cancer cell plasticity and suggest that CIN can be controlled by extracellular factors derived from normal and tumor cells, and EFEMP1 is one of these factors.
Keywords
Introduction
Cancer has long been known as a disease associated with genetic defects, largely represented by aneuploidy at both early and late stages, which are maintained in local recurrences and metastases of tumors and the derived cell lines[1-4]. Recent advances in high-throughput sequencing technology enabling analysis of single cancer cell’s transcriptome and genomics by RNA and DNA sequencing, respectively[5,6], have revealed shockingly large degrees of cancer cell phenotypic and genetic diversity[7,8], which is consistent with the long-seen hallmark of cancer, namely intratumoral cellular heterogeneity (TH), cellular differences in morphology, transcriptome, metabolism, motility, and angiogenic, proliferative, immunogenic, and metastatic potential within a single neoplasm[9-12].
There have been reports of TH for both non-heritable (non-transferable) and heritable (transferable) sources of diversity in tumor cell populations. Non-heritable sources are mainly described for phenotypes of cancer stem cells in re-initiation of cancer, and epithelial-mesenchymal transition and endothelial trans-differentiation that resemble those of embryonic cells by epigenetic re-programing. Heritable sources are cells with genetic mutations and karyotype and DNA copy number variations, and even epigenetic modifications. Tumor-specific aneuploid cells with different tumor-forming phenotypes and the stable states of TH are strongly influenced by chromosomal instability (CIN) and the tumor microenvironments. Studies by Hu et al.[13] demonstrated a connection between non-heritable and CIN-related heritable sources, and was supported by a further study by our lab[14]. There studies suggest that mis-segregation (MS) of tumor-specific chromosome or variable distribution of chromosomal fragments with oncogene amplification, known as double minute (DM), is one of the control mechanisms in maintaining diversity in tumor cell subpopulations that are functionally complementary in tumor formation, hence it underlies the recurrence of glioblastoma multiforme (GBM) after bulk tumor resection and chemo/radiation therapy.
The cancer-driving role of CIN is well supported by experimental data. As shown by Klein et al.[15], activated oncogenes destabilize karyotypes and function indirectly, like carcinogens. Mitotic checkpoint defects are the major causes of aneuploid cells, and most turn out to be unviable[16-18]. The ability to produce aneuploid cells allows selection to take place which is essential to cancer evolution[19]. It is also a fast evolving mechanism employed by yeast[20]. The catalytic role of CIN on increasing tumor cell genetic clonal diversity in causing tumor progression has been suggested by a theoretical study of cancer progression[21], and supported by a study on clinical samples of esophageal adenocarcinoma[22]. Cells differing in aneuploidy would differentially grow in different tumor microenvironments, e.g., hypoxia, low pH, providing a tumor survival benefit under changing environmental circumstances[23,24]. No doubt, CIN defined cancer plasticity has challenged cancer treatment thus far[25-31].
As revealed by single-cell RNA and genomic sequencing, tumor cell subpopulations differ genetically (in number of genes and chromosomes and DNA methylation) and in transcriptome, which leads to phenotypic and functional subpopulation diversity and ultimately to cancer plasticity. The characteristics of tumor cell subpopulations and the dynamic steady state of tumor cell subpopulations are established through selection in favor of cancer persistence and growth. To understand the resistance of cancer to therapeutic interventions (bulk tumor resection, chemo/radiation therapy, targeted therapy, etc.), it is important to understand both the formation and maintenance of TH.
From CIN-empowered cell variables, the successful selection in favor of cancer development would simplify the tumor-ecology by streamlining subpopulation diversity down to only the essential subpopulations; to form a team of synergistically interactive functional tumor cell subpopulations that would drive the fast growth and invasive characteristics of cancer. In such stage of cancer evolution, CIN would work against cancer by de-stabilizing the optimal tumor-ecology. In this scenario, selection would be directed to suppress CIN. Thus both promotion and inhibition of CIN are important events favoring successful cancer evolution. Understanding such “Yin” and “Yang” reciprocal aspects of CIN could facilitate development of therapeutic strategies, which could potentially prevent cancer recurrence.
This study attempts to explore this possibility, by studying a cell line model of GBM in which two tumor subpopulations have been functionally characterized as stem-like tumor initiating cell (STIC) and tumor mass-forming cell (TMC), defined by different copies of chromosome 7 (Chr7), and their inter-conversions via MS of Chr7[13]. We further studied our prior finding of changes in the steady state of Chr7-defined subpopulations in response to microenvironmental cues and an extracellular protein named fibulin-3, or EGF containing fibulin-like extracellular matrix protein 1 (EFEMP1)[32].
Methods
Ethics statement for human tissues
Tumors from Tissue Bank of UC Irvine and University of Arkansas for Medical Science were included in this study, with Institutional Review Board approval, as reported previously[33].
Cell cultures
The human glioma cell line U251 (also known as U251HF) was obtained from M.D. Anderson Cancer Center, University of Texas. U251-NS is a single-cell line of neural sphere culture of U251 established at UC Irvine Brain Tumor Research Laboratory. Characterization of U251 with phenotypes defined as tumor mass-forming cells (TMC) and U251-NS as stem-like tumor initiating cells (STIC) and their Short Tandem Repeat (STR) profiles were reported previously[13]. EFEMP1 and Empty/pTRIPZ lentiviral vectors and their transduced glioma cells (U251 and U251-NS) were described by Hu et al.[32].
U251 (including those infected by lentiviral vectors) was grown in monolayer cultures in DMEM/F12 supplemented with 5% bovine serum, respectively, while U251-NS (including those infected by lentiviral vectors) were grown in 1% agar-coated plates in DMEM/F12 supplemented with epidermal growth factor (EGF, 20 ng/mL), basic fibroblast growth factor (FGF, 10 ng/mL), and 1% B27 (Invitrogen, Carlsbad, CA). U251-NS was attached in fibronectin (10 mg/mL)-coated plates prior to FISH analysis.
Fluorescence in situ hybridization
The methods for fluorescence in situ hybridization analyses on glioma specimens, glioma xenografts from intracranial models of mice, and cell cultures were reported previously[32]. Briefly, metaphase-spread slides were obtained by exposing exponentially growing cells to nacadozole solution (100 µg/mL final, Sigma) for 1 h. Then the cells were trypsinized (0.25% trypsin/EDTA, Invitrogen) to collect cell pellets, which were treated with a hypotonic solution (phosphate buffer) for 5 min at 37 ˚C. The cell pellets were fixed (methanol:glacial acetic acid = 3:1) for at least 30 min. Finally, the cell suspensions were dropped onto slides to get metaphase chromosome spreads. Cryosections (7 mm) of human glioma and epilepsy brain tissue frozen specimens, and mice brain with i.c. xenografts of glioma cells were fixed with 100% methanol for 5 min. The slides were further treated with 0.3% sodium citrate solution for 10 min in a pressure cooker, and rinsed with water briefly. FISH analyses on glioma cells and tissues were performed using Vysis LSI EGFR SpectrumOrange/CEP 7 SpectrumGreen Probes (Abbott Molecular Inc) following the manufacturer's instructions. Cells were counted on slides using a Nikon Eclipse TS100/TS100F fluorescent microscope with a 100× lens.
The numbers of Chr7 centromeres per nucleus, detected by the FISH CEP7 probe, were counted and the percentages of cells with different copies of Chr7 were determined based on counting of more than 250 nuclei per sample of tumors or cell cultures. These data were used to establish the level of tumor heterogeneity with regard to Chr7-defined cell subpopulations. The Shannon diversity index (H) was calculated to show the degree of diversity with regard to Chr7-tumor cell subpopulations as described previously[22].
Real-time comparative quantitative polymerase chain reaction
DNA samples from frozen glioma specimens were isolated using a DNeasy kit (QIAGEN, Valencia, CA). Comparative quantitative polymerase chain reaction (CQ-PCR) standards (CQ101 for EGFR and CQ102 for PTEN) and PCR primers of EGFR, PTEN, and three reference genes on 2q34 (SPAG16), 3p14.3 (ERC2), and 5q31.2 (SPOCK1) were from Ziren Research LLC (Irvine, CA). It is a recombinant DNA containing PCR fragments of EGFR or PTEN and reference genes in one piece to determine copy number variation (CNV) as described previously[33]. Real-time PCR was carried out using FAST-START SYBR-Green I Master Mix (Roche).
Statistical analysis
Two tailed T-tests with equal sample variation were performed to measure significance on pairwise comparisons, with P < 0.05, 0.01, and 0.001 are shown in presented figures.
Results
Increase of trisomy-7 and Chr7-defined cell diversity in higher grades of glioma
Using FISH analysis with dual probes for centromere 7 and EGFR, our prior studies showed common alterations of Chr7, both in number and structure in established glioblastoma multiforme (GBM) derived cell lines of U251, A172, LN229, and T98G, and an increasing Chr7 score (average copy of Chr7 per cell) along with increase in the grade of human gliomas[13]. Here we re-analyzed the FISH data on these gliomas, and showed a significantly higher percentage of cells with 3 copies of Chr7 in GBM (grade 4, n = 16) compared to oligodendroglioma (OG, grade 2, n = 12) [Figure 1A]. The Shannon diversity index (H) was calculated based on the percentages of four Chr7-defined cells shown in Figure 1A, to compare the degree of tumor subpopulation diversity between different grades of gliomas. As shown in Figure 1B, gliomas of all grades presented significantly higher value of H-index compared with non-tumoral brain tissues from patients with epilepsy. Furthermore, grade III AO and IV GBM both showed significantly higher values of H-index compared with grade II OG, due to significant increase of cells carrying 5 and 3 copies Chr7, respectively.
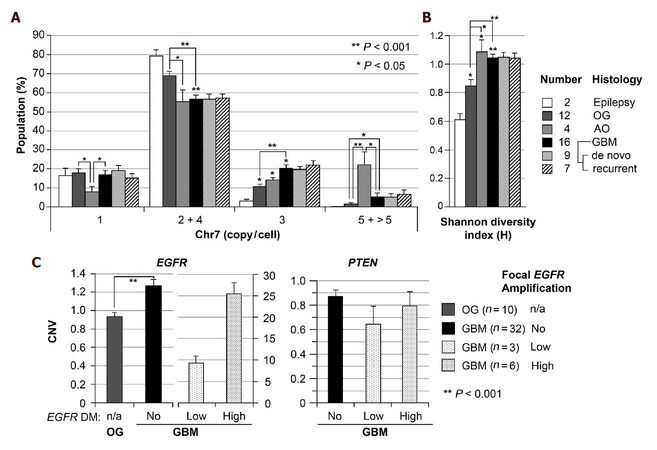
Figure 1. Increase of trisomy-7 cell percentage and Chr7-defined cell diversity in higher grade of glioma. (A) Chr7-subpopulations in gliomas of WHO grades II (Oligodendroglioma, OG), III (anaplastic oligodendroglioma, AO), and IV (glioblatoma multiforme, GBM), determined by FISH. Cells with 4 copies of Chr7 were considered as tetraploid cells with 2-Chr7; (B) shannon diversity index (H) calculated based on the percentage of cells in four groups shown in A; (C) comparison of copy number variation (CNV) of EGFR and PTEN in gliomas by CQ-PCR analysis of DNA samples. Bar height and error bar are mean and SEM of individual tumors
To determine if the observed increase in cells with 3 copies of Chr7 are trisomy-7 or triploid cells, we performed CQ-PCR for CNV of EGFR on 7p in reference to three single-copy genes (ERC2, SPAG16 and SPOCK1) on three different chromosomes (3p, 2q and 5q, respectively) in a larger set of human glioma samples, including OG and GBM tissues used in FISH analyses. As shown in Figure 1C, most of GBMs (78%) showed significantly (on the average of 1.3-fold) higher copies of EGFR compared with that of OGs. About 22% of GBM showed very high copies of EGFR, with 7%, on the average 9-fold higher and 15%, on the average 26-fold higher, from focal EGFR amplification. As reported previously, this is due to extrachromosomal oncogene amplification or double minute chromosome (DM)[34]. In contrast to overall increase of EGFR CNV, CQ-PCR showed overall decrease of PTEN gene copy, with an average of less than 1 ratio of PTEN to one of the three reference genes. Taking together, data from FISH and CQ-PCR are consistent with increase of trisomy-7 population in GBM as compared with OG.
Low cell-plating density caused increase of CIN rate
We have previously presented two GBM heterogeneity models where variations in Chr7 or DM status characterized tumor subpopulations functionally defined as TMC and STIC, which were enriched by certain in vitro culture conditions, known as serum-adherent (SA) and neurosphere (NS) conditions, respectively[13,14]. The dynamic state of tumor sub population diversity was stabilized with one dominant subpopulation over long-term passages at high cell-plating densities without changing culture conditions. However, under the same culture conditions, single-cell cultures, derived from single cell or soft agar colony, presented not only diverse cell populations, but also higher degrees of heterogeneity compared with their parental cultures. Examples are Chr7-defined subpopulations in single-cell SA and NS lines of four established GBM cell lines (U251, A172, LN229, and T98G)[13], as well as DM-defined subpopulations in single-cell NS line of a GBM-derived primary culture 51A[14]. The explanation of this phenomenon would be an increase of CIN rate, shown by increase of MS rate of the subpopulation-defining chromosome or DM, due to loss, and dramatic weakening, of inhibitors of CIN (InCIN) in initial and subsequent cell divisions of single-cell lines.
To test the hypothesis that regulation of CIN rate is paracrine-mediated, Chr7-FISH was carried out in U251 derived from serial decrease of cell-plating density from that normally used in cell passages (~10,000 cells/cm2). U251 cells at above 90% and about 40% confluence from plating with 10,000 and 1000 cells in a 24-well plate were fixed 2 days later for FISH analysis. Cells from three selected wells, each containing 16 colonies one week after seeding 50 cells per well in a 24-well plate, were detached by trypsin-EDTA and passed into a 35-mm dish and cultured for two days prior to FISH analysis. The percentages of cells with Chr7 copy of 1, 2 & 4, and 3 & 6 of U251 derived from various cell-plating density were plotted in the left panel of Figure 2A, and the H-index calculated based on the percentages of these populations was shown in the right panel of Figure 2A.
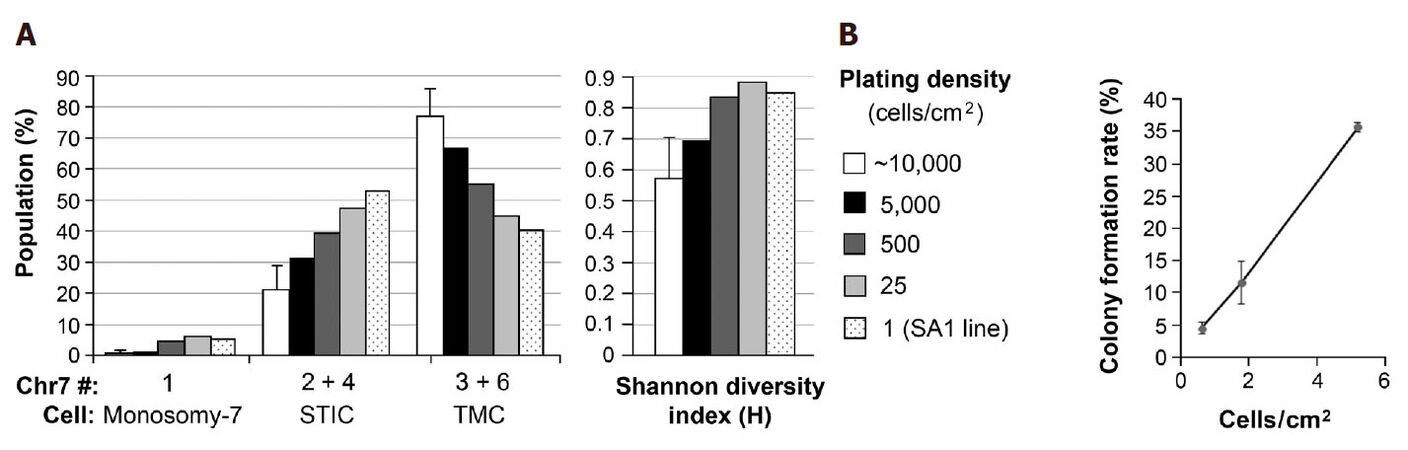
Figure 2. Increase in population diversity and decrease of cell viability both correlate with decrease in cell plating density. (A) Chr7-FISH was carried out in U251 cultures plated at various cell densities and in SA1, a clonal line of U251 established in serum-containing medium. Based on near diploid karyotypes of cells in U251, cells carrying 1, 2 & 4, and 3 & 6 copies of Chr7 were denoted as monosomy-7 cells, STIC and TMC, respectively, as described previously[13]. Shannon diversity index was calculated based on the percentages of these three cell subpopulations, as described previously[22]; (B) colony formation rate from one week culture of 50 cells of U251 in 35, 60, and 100 mm dishes in 3, 4, and 10 mL of medium, respectively, in 4-6 replicates
We have shown previously that TMC in U251 carrying 3 copies of Chr7, 2 normal, 1 with q-arm deletion, denoted as 3-Chr7 (2n, 1d), and STIC carrying 2 copies of Chr7, 1 normal, 1 with q-arm deletion, denoted as 2-Chr7 (1n, 1d). Counting of whole chromosome number (WCN) for 145 metaphase nuclei of U251 and U251-NS showed that the majority (87%) have aneuploid karyotypes with a modal chromosome number of 50. Hence both cells with 2 or 3-copies of Chr7, which were differentially enriched in U251-NS and U251, respectively, had near diploid karyotypes. The small portion (4%-5%) of cells with 4 and 6-copies of Ch7 were therefore considered as transient tetraploid stages of STIC and TMC, respectively, as shown in Figure 2A. Monosomy-7 cells with 1 copy of Chr7 in U251 were also near diploid.
As shown in Figure 2A, decreasing cell plating density of U251 cultures in the same surface area and volume of culture medium caused a gradual decrease in percentage of TMC (67%, 55%, 45%, and 40%) along with a gradual increase in percentage of STIC (31%, 40%, 48%, 53%), leading to a gradual increase in population diversity, as shown by increase of H-index value. SA1 is a single-cell line of U251 formed and expanded in SA conditions. Its CGH profile confirmed its origin from a TMC in U251[13]. As shown in Figure 2A left panel, the percentage of STIC (53%) in SA1 was slightly higher than that of TMC (40%). While in its parental culture, TMC was the dominating population (average 77%), based on analyses of four different passages. Because there was no change in culture conditions from SA to NS, which is favorable or against the growth of STIC or TMC, respectively, the observed increase in percentages of STIC and corresponding decrease of TMC would mostly due to increase of Chr7-MS rate by TMC in responding to decrease of paracrine effect of InCIN from decrease of cell plating density.
We then analyzed colony formation rate of U251 in SA conditions, by plating 50 cells of U251 in 35, 60 and 100 mm dishes with nearly 3-fold serial increase of surface areas from 10 to 28, and to 79 cm2. As shown in Figure 2B, there was a near 3-fold of serial decrease of colony formation rates, which is not related to changes in volume of culture medium (from 3 to 4, and to 10 mL), but to cell plating density. Clearly, it is more to the change of cell density that changed cell viability in colony formation assay. According to notion that most aneuploid cells from chromosomal MS are nonviable, decrease of cell survival would be consistent with increase of MS rate, in response to decrease of cell-plating density in above described colony formation assay.
Taken together, results of FISH analysis showed increase in population diversity, and colony formation assay showed decrease in colony formation rate due to increase of two dimensional cell density of U251. Overall our data are consistent with paracrine control of cancer cell CIN rate, by local concentration of extracellular factors secreted by its self as well as its neighboring cancer cells.
Extracellular control of CIN in maintenance of TH
The above described increase of CIN rate in establishment of single-cell lines and a negative association between population diversity and cell-plating density suggest paracrine control of cancer cell CIN rate, with InCIN acting in the extracellular compartment. This conclusion was supported by FISH analyses of intracranial (i.c.) xenografts derived from U251-NS with different inoculum sizes. U251-NS is a single-cell line of U251 with 90% STIC under NS-conditions which did not support the growth of TMC[35]. The small (1%-2%) portion of TMC in U251-NS is likely from Chr7-MS of STIC as demonstrated in mathematical modeling[13]. After changing the in vitro culture environment to orthotopic in vivo environment of glioma, the percentage of monosomy-7 cell and TMC markedly increased, which were found physically near each other in xenografts[13], suggesting increased rate of Chr7-MS of STIC. The dramatic increase of monosomy-7 cell from 5% to more than 20% due to changing environments of in vitro to in vivo could be explained by increase of survivability or growth speed of monosomy-7 cells in vivo, as compared to in vitro.
We have previously reported FISH analyses of intracranial (i.c.) xenografts derived from intracranial implantation of U251-NS cells infected with lentiviral vector pTRIPZ to express EFEMP1 (named U251NS-EFEMP1) under promoter controlled by doxycycline (Dox)[32]. We observed similar cell subpopulations in i.c. xenografts of U251NS-EFEMP1 (-Dox) and U251-NS with inoculum size of 100,000, where 55% were STIC and 23% monosomy-7 cells. Here we compared Chr7-defined subpopulation proportion as the steady state of TH and Shannon diversity index value in xenografts derived from the same implantation of U251NS-EFEMP1 (-Dox) but variable inoculum sizes. As shown in Figure 3A, xenografts derived from a small inoculum (1000 cells) of U251NS-EFEMP1 (-Dox) were nearly equally (45%, 50%) composed of monosomy-7 cell and STIC, respectively, which was in striking contrast to xenografts of U251NS-EFEMP1 (-Dox) of 10- and 100-fold larger inoculum sizes. There were significantly higher percentage of TMC and lower percentage of monosomy-7 cells in xenografts of 10,000 and 100,000 inoculums leading to their higher H-index values and shorter survival of mice, compared with that of inoculum of 1000 cells.
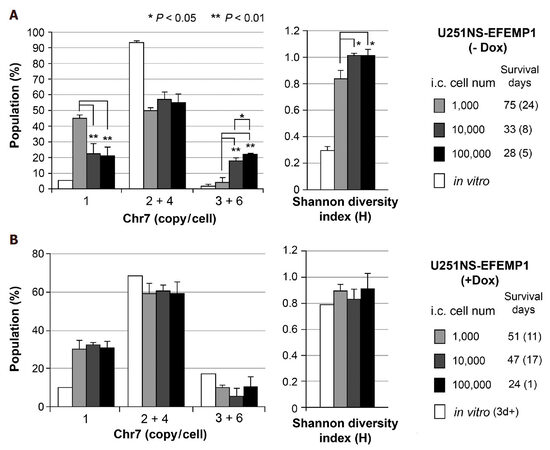
Figure 3. Increase in TH in vivo due to decrease of cell inoculum size and inhibition of CIN from overexpression of EFEMP1. (A) comparison of Chr7-subpopulations in xenografts derived from intracranial (i.c.) implantation of U251-NS at various inoculum sizes (1000, 10,000, and 100,000 cells/3 mL); (B) comparison of Chr7-subpopulations in xenografts of U251-NS from various inoculum sizes and with expression of ectopic EFEMP1 induced by treatment with Dox. See for Chr7-defined populations. Bar height and error bar are mean and SD of individual mice. Data from FISH analyses and mice survival were reported in Hu et al.[32]
The monosomy-7 cell remained slow-growing under both in vivo (as shown in Figure 3A by median 75 days survival of mice with i.c. xenografts containing 45% monosomy-7 cells vs. 33 days survival of mice with i.c. xenografts containing 20% monosomy-7 cells), and in vitro environments, and never became a population larger than 5% in both U251 and U251-NS in vitro cultures, as well as in single-cell or low-density cultures of U251. Thus, it would be the increase of Chr7-MS by STIC, not the increase of monosomy-7 cell growth speed that explains the dramatic difference in increase of monosomy-7 cell percentage in xenografts from a small number of cell implantation, as compared with that from 10 and 100-folds higher inoculum sizes. This demonstrates the negative association of cell density and Chr7-MS rate by STIC in initial and subsequent cell divisions following i.c. tumor cell implantation. The significantly higher percentage of TMC in xenografts of U251NS-EFEMP1 (-Dox) with inoculum size of 100,000 cells compared with that of 10,000 cells is functionally related to the shorter survival of mice from the fast growth features of TMC, although their differences on Shannon diversity index and survival are not significant, but both are significantly different from that of inoculum size of 1000 cells. Such cell density-related threshold of extracellular factors in control of Chr7-MS rate were also observed in TMC in U251 in vitro culture under SA-conditions [Figure 2], both demonstrating extracellular control of CIN in maintenance of TH.
EFEMP1 is an inhibitor of CIN
The cell density-dependent negative effect on CIN rate suggests paracrine-control of CIN. Below we present the CIN inhibition function of an extracellular matrix protein EFEMP1 (also known as fibulin-3) that was initially reported as a senescent protein[36], and later widely reported in cancers[37], with cell-context-dependent dual functions in TMC and STIC in U251 and U251-NS lines, respectively[32].
Ectopic EFEMP1 was induced by adding Dox (1 mg/mL) to culture medium for about 1 day and maintaining EFEMP1 overexpression in xenografts was achieved by providing Dox (1 mg/mL) in drinking water of mice throughout the experiment. The tumor-promoting role of EFEMP1 in STIC, as suggested by its pro-invasive function in STIC shown in a matrigel invasion assay, could only be seen in small inoculum sizes of 1000 where the size of TMC number was too small to manifest EFEMP1’s suppression role, as shown in xenografts from medium (10,000) and large (100,000) inoculum sizes[32]. FISH analyses showed lack of significant difference in both the steady state Chr7 subpopulations and H-index in xenografts of U251NS-EFEMP1 (+Dox) of various inoculum sizes [Figure 3B], which was in striking contrast to that of U251NS-EFEMP1 (-Dox) shown in Figure 3A. Besides the dual functions of EFEMP1 in TMC and STIC, EFEMP1 was further demonstrated to carry a role as InCIN, to suppress the increase of Chr7-MS by STIC during formation of i.c. xenografts.
As reported previously in our studies of the tumor suppression function of EFEMP1 in glioma, long-time in vitro overexpression of EFEMP1 in U251 amplified a population carrying two normal copies, denoted as 2-Chr7 (2n), barely seen in parental culture, into the majority subpopulation (about 80%) in U251-EFEMP1 (+Dox). In contrast to high tumorigenicity of U251 where TMC (3-Chr7 (2n, 1d)) was the dominant subpopulation, U251-EFEMP1 (+Dox) with majority cells carrying 2-Chr7 (2n) showed significantly lower tumorigenicity even after withdrawal of Dox in subcutaneous xenograft models[13]. In this study, we examined the effect of EFEMP1 on control of Chr7-MS rate in 2-Chr7 (2n) cells enriched in U251-EFEMP1 (+Dox).
FISH analysis was carried out on in vitro cultures of U251 transduced with the empty vector of pTRIPZ and Dox-controlled transient- and stable-expression of ectopic EFEMP1. As shown in Figure 4, Chr7-defined steady state of TH in U251 was similarly shown in U251-Vector after a 10-day Dox-treatment. The arrowhead marked one chromosome 7 with 7q deletion (1d), which was specifically found in both TMC (2n, 1d) and STIC (1n, 1d), as reported previously[13]. For studying the effect of EFEMP1, U251-Vector was used as control for the effect of vector and dox-treatment. As shown in Figure 4, Chr7-defined steady state of TH in U251 was dramatically altered due to EFEMP1 overexpression, with 69%, 44%, 9% of TMC present in cultures after 2, 14, and over 60 days of Dox-treatment. After lengthy induction of ectopic EFEMP1 by Dox, even after withdrawal of Dox for a week, nearly 80% of cells in U251-EFEMP1 (+Dox) and U251-EFEMP1 (withdrawal of Dox) carried similarly high percentages of 2-Chr7 (2n) cells. This demonstrated that the new steady state of tumor subpopulation induced by EFEMP1 persisted for some time, even after the extent of EFEMP1 overexpression was eliminated or minimized. Long-term expression of ectopic of EFEMP1 changed the steady state of U251 subpopulations with key subpopulation of 2-Chr7 (2n) of low tumorigenicity.
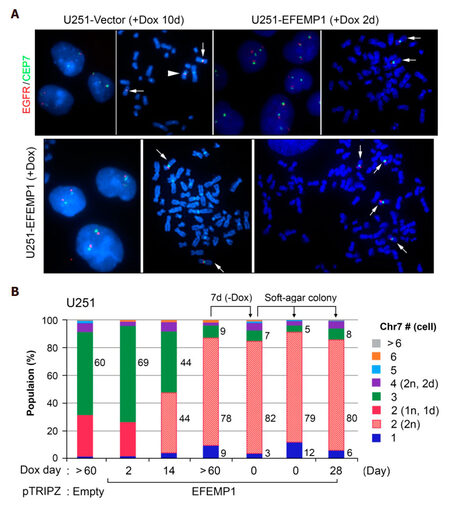
Figure 4. FISH analyses of in vitro cultures of U251 with transient and long-term expression of ectopic EFEMP1. (A) representative FISH interphase and metaphase nucleus images of U251 transduced by lentivirus of empty vector or doxycycline (Dox)-induction of ectopic EFEMP1. Normal Chr7 was shown by a white arrow, abnormal Chr7 (with amplification of p-arm and deletion of q-arm) by a white arrowhead; (B) comparison of Chr7-subpopulations in various U251 cultures with or without EFEMP1 overexpression
We then studied MS rate of this low tumorigenic 2-Chr7 (2n) subpopulation of U251, by analyzing two single-cell lines derived from soft-agar colonies of U251-EFEMP1 (withdrawal of Dox) formed and expanded with or without Dox-treatment. FISH analysis showed similarly high percentages of 2-Chr7 (2n) cells in U251-EFEMP1 (withdrawal of Dox) and its derived single-cell lines, regardless of Dox-treatment [Figure 4B]. The lack of increase in cell population diversity in single-cell lines of U251-EFEMP1 (withdrawal of Dox) suggests a lower CIN rate of cells with 2-Chr7 (2n) in U251, which is in striking contrast to that of single-cell lines of high tumorigenic glioma cell lines, as described above and shown in Figure 2A.
As in U251 and U251-NS cultures, monosomy-7 cell in U251-EFEMP1 (withdrawal of Dox) is a result of Chr7-MS following proliferation of 2-Chr7 (2n). Withdrawal of Dox-induced EFEMP1 from U251-EFEMP1 (+Dox) mainly caused a 3-fold decrease of monosomy-7 cell percentage from 9% to 3%, suggesting a pro-CIN effect of Dox or its induced ectopic EFEMP1. The latter has shown an InCIN effect in TMC and STIC populations as described above. FISH analyses showed that the percentage of monosomy-7 in single-cell lines of U251-EFEMP1 (withdrawal of Dox) without or with Dox-treatments were increased by four- and two-fold, respectively, compared with their parental line [Figure 4B]. Hence in 2-Chr7 (2n) cells of low tumorigenicity and low CIN rate, EFEMP1 has also played the role of InCIN.
Discussion
TH is a hallmark of the most malignant glioma, glioblastoma multiforme (GBM) where “M” stands for “multiforme” based on the degree of tumor cell diversity assessed solely with histopathology, both between different tumors and, within the overall cell population of any given individual tumor. If they do not succumb to their original tumor, most patients with GBM go on to experience tumor recurrence, despite surgical resection, post-operative radiation and chemotherapy. There is no histological or cytogenetic difference between primary and recurrent GBM (regardless of multiplicity of treatments and recurrences). Most GBMs (about 80%) show loss of chromosome 10 (monosomy 10)[38], with activation of PI3K-mediated growth signaling as a result of loss of tumor suppressor PTEN leading to aggressive growth[39]. The other most commonly seen numerical chromosome aberration in GBM is gain of Chr7 (trisomy/polysomy 7)[40]. Chr7 copy number variation, including monosomy 7, occurs in both high- and low-grade gliomas, and appears to be associated with invasive and proliferative cell phenotypes[40-44]. Through FISH analysis of individual cells within glioma tissue and CQ-PCR analysis of whole tissue, we showed increased Chr7-defined cell diversity in comparison to non-tumoral tissues of brain, and the positive relation of this diversity to the malignant nature and behavior of these tumors. The grade-dependent increase of trisomy-7 cells may have functional implications, e.g., a high proliferative phenotype, as also suggested by other studies[40]. Comparing grade II and III gliomas with oligodendroglia components, the observation of high percentage of cells with 5 copies Ch7 and low percentage of cells with 1 copy of Chr7 in AO could be functionally significant with increase of malignant phenotype due to increase of CIN rate, which requires further study with larger sample sizes of AO.
From analyzing the distributions of Chr7-defined subpopulations in GBM-derived cell line U251 and its clonal subculture line U251-NS under both in vitro and in vivo conditions, overall our findings support the idea that MS rate increased by the dominating tumor cell subpopulation in U251 [Figure 2] and U251-NS [Figure 3A] in response to decrease of two and three dimensional cell densities, respectively, and in U251-EFEMP1 (+Dox) in forming soft agar colonies [Figure 4B]. Our conclusion of increasing MS rate is not from the direct measurement. The increase of MS rate of the dominating TMC subpopulation in U251 was concluded based on a serial reduction of its percentage along with increase of the minor STIC subpopulation [Figure 2A] and decrease of cell viability [Figure 2B] due to decrease of cell plating density. Given the same culture conditions that were unfavorable to monosomy-7, less supportive to STIC, and favorable to TMC, results from this experiment undermines the impact from cell plating density on each subpopulation’s proliferation and/or death rate which may affect the state of TH. In contrast, it highlights the immediate impact from the dramatic decrease of local extracellular factors. In U251-NS, where STIC was the key cells, similar results was observed suggesting increase of MS rate due to decrease of cell density [Figure 3A]. Base on mouse survival that is negatively related to the speed of tumor growth, monosomy-7 cells remain slow-growing under in vivo conditions. The increase of monosomy-7 percentage in i.c. xenograft of U251-NS compared to that of in vitro culture suggests less apoptotic rate of monosomy-7 cells in conditions of in vivo vs. in vitro. The significant increase of monosomy-7 cell portion in xenografts from decrease of inoculum size could be mainly caused by an increase of MS rate of STIC in responding to dramatic decrease in concentration of local extracellular factors playing roles as InCIN, including EFEMP1.
Relying on GBM’s divergent “grow” or “go” cellular phonotypes of GBM cells, to study plasticity of GBM cells and the mechanisms of GBM recurrence after aggressive post-surgical therapies, we simplified our study by focusing on tumor cell subpopulations with these two diverse phenotypes. STIC subpopulation reflects the “go” phenotype and TMC subpopulation reflects the “grow” phenotype, with differing chromosomal markers defining these two functional subpopulations. Overall our published and new data presented here suggest that the plasticity of GBM cell is under paracrine-control of the CIN rate, represented by MS of a subpopulation-specific chromosome. Consistently, we showed that the more confluent the cells, the more the inhibition of CIN. A model for recurrence of GBM is presented, assuming differential intra- and peri-tumoral distributions of slow-growing invasive STIC and fast growth TMC, with a low CIN rate in the bulk of the tumor mass (TM) and a high CIN rate in invaded parenchyma of peritumoral tissue (PT) for both subpopulations [Figure 5A]. We propose that CIN rate is not only modulated by tumor microenvironment, but also by current cytotoxic therapeutic interventions, such as irradiation, which can assist in the re-establishment of TH optimized through evolutionary selection pressures leading to re-establishment of the steady state of subpopulations in prior established GBM [Figure 5B].
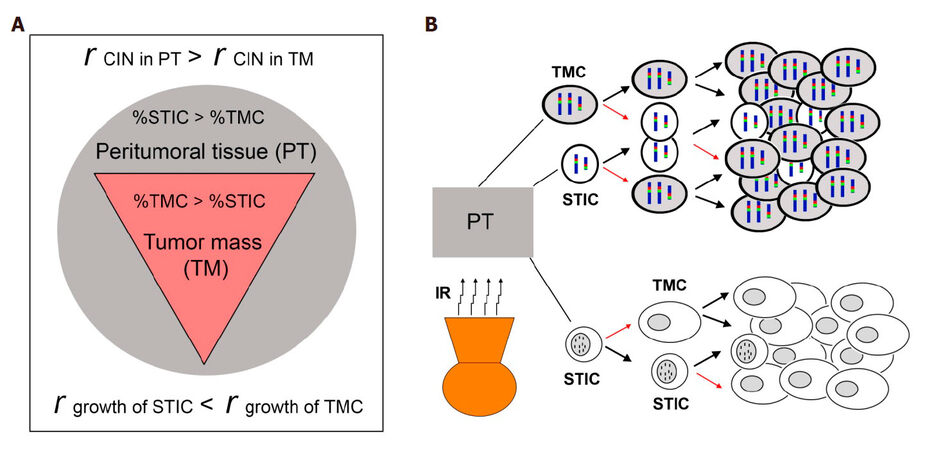
Figure 5. A model of GBM with TH and CIN in control of tumor recurrence. (A) differential intra- and peri-tumoral distributions of slow-growing invasive STIC and fast growth TMC, and differential CIN rate in the bulk of tumor mass (TM) and parenchyma of peritumoral tissue (PT); (B) recurrent GBM models from Chr7- and DM-defined STIC and TMC based on published studies[13,14]. A thick black arrow shows the proliferation of cells to re-populate, and a thin red arrow shows the proliferation of cells with MS of Chr7- and DM, giving rise to other functional subpopulations
In these two GBM heterogeneity models, where Chr7 or DM-defined two key tumor subpopulations which function as STIC and TMC, we showed that the two subpopulations could be differentially enriched by SA and NS culture conditions. The steady state of TH with one subpopulation as majority remained stable over long-term passages under the same culture conditions (SA or NS). In a Chr7-defined heterogeneity model of GBM, the mathematical model revealed that it is Chr7-MS that prevents the phase out of the slow-growing subpopulations in either condition, even at a rate as low as ~0.01 or 0.001 for TMC or STIC, respectively, per cell division[13]. The calculated MS rates of TMC and STIC in Chr7-defined heterogeneity model of GBM are in the range of aneuploidy rates reported in human cancer cells[17] and yeast[20]. In a DM-defined heterogeneity model of GBM, we demonstrated regain of TH by STIC (with DM) giving rise to TMC without DM[14]. The MS rate of DM in stabilized status has not yet been determined. Overall, this model defines CIN, represented by MS of the subpopulation-defining chromosome (e.g., Chr7, DM), to cause TH with functionally diverse tumor subpopulations in de novo tumor and it restoration in recurrent tumors.
The balance of between CIN and InCIN in cancer evolution
Aneuploidy in clinical specimens and their derived cell lines is a hallmark of cancer; thus CIN has been proposed to be a driving force of cancer evolution. CIN can readily and rapidly, in a time frame of one cell division, give rise to tumor cells with diverse genotypes that lead to dramatic changes in transcriptional profiles, and thus affect the behavior and survivability of the progeny cells. Based on CIN-created cell variables, cancer would start by successful selection of those cells with oncogenic functions and then progress by further successful selection of a team of synergistically interactive and mutually supportive functional tumor cell subpopulations that drive the fast growth and invasive characteristics of cancer. Paradoxically on occasion, CIN could also apparently interfere with cancer evolution by producing large number of cells lacking oncogenic function and viability as well as loosening the steady state of TH optimal for cancer’s growth or de-stabilizing the optimal tumor-ecology. In these occasions, selection would be directed to suppress CIN, in maintaining the team of tumor cell subpopulations with diverse functions and symbiotic relationships. This leads to the ability to adjust the MS rate in proliferating tumor cells in accordance to their local extracellular cues from the dynamic tumor microenvironment.
The existence of inhibitor(s) of CIN made and secreted by cancer cells into extracellular compartments and their dose-dependent function on suppressing CIN was demonstrated by our data published and new experiments detailed above. The key evidence comes from findings that MS rate was uniformly increased in single-cell cultures of all examined GBM cell lines and primary cultures, and this increase of MS rate was associated with reduction of cell plating density in vitro and inoculum size in vivo. Results from both in vitro and in vivo models showed saturation effect on population diversity from a high cell density, such as 5000-10,000 cells/cm2 for U251 and 10,000 and 100,000 inoculum size for U251-NS, suggesting a balance was reached between CIN and InCIN that benefit the overall growth of the culture or tumor under the described conditions.
Overall, the studies presented here suggest that both CIN and InCIN contribute to the establishment of steady state of TH optimal for tumor growth as well as survival and re-emergence after conventional therapy. The higher the grade of malignancy, the more efficient the component of tumor subpopulations and interactions are, for optimal growth and support from tumor microenvironment. Since gliomas can progress from lower grades after therapy to higher grades with increase of diversity in tumor subpopulations [Figure 1B], this proves increase of tumor cell diversity in cancer evolution. Selection in favor of tumor growth would lead optimal steady state of TH with specific tumor subpopulations and tumor ecology.
Tumor cells are further empowered with a sensing system to increase or decrease the rate of CIN in order to maintain the species of functional tumor subpopulations and the steady state of TH optimized in growth under a given environment, or to establish new species of functional tumor subpopulations and a new steady state of TH to cope with damages in their living environments, from over-growth or therapeutic interventions. If CIN is a primary driver in cancer evolution, InCIN would be a necessary component of that driver that empowers cancer development in a more effective and efficient way. This endows power of change and flexibility upon cancer evolution, which is an inherent mechanism of cancer recurrence, following surgical resection and therapeutic interventions currently practiced, such as chemo and radiation for GBM. Given the fact that at least one resistant subpopulation of tumor (e.g., STIC) has the ability to increase the MS rate by sensing InCIN dynamics, tumor recurrence in local (GBM) and distant (other types of cancers) places is guaranteed. Understanding the “Yin” and “Yang” reciprocal aspects of CIN and their control of TH dynamics would lead to an entirely new and exciting era towards improving cancer treatment involving directed perturbation of CIN and/or InCIN in ways that will not allow for establishment, or maintenance, of optimal synergistically interacting and mutually supporting tumor subpopulations and tumor-supporting micro-environment.
Declarations
AcknowledgmentsWe thank Ning Ru for assistance in FISH analysis on glioma cell lines, Liping Yu and Abhishek Chaturbedi in CQ-PCR analyses on DNA samples of gliomas.
Authors’ contributionsConceived this study, designed and performed the experiments, analyzed the data, and wrote the manuscript: Zhou YH
Participated and edited the manuscript: Afrasiabi K, Linskey ME
Availability of data and materialsData and materials will be open to readers upon request.
Financial support and sponsorshipThis work was supported in part by generous gifts from Stern Family and the Audley Fund from the Philadelphia Foundation and a grant provided by Musella Foundation for Brain Tumor Research & Information.
Conflicts of interestThe authors declare that they have no personal circumstances or interest that may be perceived as inappropriately influencing the representation or interpretation of reported research results.
Ethical approval and consent to participateTumors from Tissue Bank of UC Irvine and University of Arkansas for Medical Science were included in this study, with Institutional Review Board approval. No further consent is needed.
Consent for publicationNot applicable.
Copyright© The Author(s) 2018.
REFERENCES
1. Rajagopalan H, Nowak MA, Vogelstein B, Lengauer C. The significance of unstable chromosomes in colorectal cancer. Nat Rev Cancer 2003;3:695-701.
2. Wiltshire RN, Rasheed BK, Friedman HS, Friedman AH, Bigner SH. Comparative genetic patterns of glioblastoma multiforme: potential diagnostic tool for tumor classification. Neuro Oncol 2000;2:164-73.
3. Ried T, Hu Y, Difilippantonio MJ, Ghadimi BM, Grade M, Camps J. The consequences of chromosomal aneuploidy on the transcriptome of cancer cells. Biochim Biophys Acta 2012;1819:784-93.
4. Holland AJ, Cleveland DW. Boveri revisited: chromosomal instability, aneuploidy and tumorigenesis. Nat Rev Mol Cell Biol 2009;10:478-87.
5. Tang F, Lao K, Surani MA. Development and applications of single-cell transcriptome analysis. Nat Methods 2011;8:S6-11.
6. Navin N, Kendall J, Troge J, Andrews P, Rodgers L, McIndoo J, Cook K, Stepansky A, Levy D, Esposito D, Muthuswamy L, Krasnitz A, McCombie WR, Hicks J, Wigler M. Tumour evolution inferred by single-cell sequencing. Nature 2011;472:90-4.
7. Gao R, Kim C, Sei E, Foukakis T, Crosetto N, Chan LK, Srinivasan M, Zhang H, Meric-Bernstam F, Navin N. Nanogrid single-nucleus RNA sequencing reveals phenotypic diversity in breast cancer. Nat Commun 2017;8:228.
8. Duan M, Hao J, Cui S, Worthley DL, Zhang S, Wang Z, Shi J, Liu L, Wang X, Ke A, Cao Y, Xi R, Zhang X, Zhou J, Fan J, Li C, Gao Q. Diverse modes of clonal evolution in HBV-related hepatocellular carcinoma revealed by single-cell genome sequencing. Cell Res 2018;28:359-73.
9. Fidler IJ, Hart IR. Biological diversity in metastatic neoplasms: origins and implications. Science 1982;217:998-1003.
11. Marusyk A, Polyak K. Tumor heterogeneity: causes and consequences. Biochim Biophys Acta 2010;1805:105-17.
12. Gerlinger M, Rowan AJ, Horswell S, Math M, Larkin J, Endesfelder D, Gronroos E, Martinez P, Matthews N, Stewart A, Tarpey P, Varela I, Phillimore B, Begum S, McDonald NQ, Butler A, Jones D, Raine K, Latimer C, Santos CR, Nohadani M, Eklund AC, Spencer-Dene B, Clark G, Pickering L, Stamp G, Gore M, Szallasi Z, Downward J, Futreal PA, Swanton C. Intratumor heterogeneity and branched evolution revealed by multiregion sequencing. N Engl J Med 2012;366:883-92.
13. Hu Y, Ru N, Xiao H, Chaturbedi A, Hoa NT, Tian XJ, Zhang H, Ke C, Yan F, Nelson J, Li Z, Gramer R, Yu L, Siegel E, Zhang X, Jia Z, Jadus MR, Limoli CL, Linskey ME, Xing J, Zhou YH. Tumor-specific chromosome mis-segregation controls cancer plasticity by maintaining tumor heterogeneity. PLoS One 2013;8:e80898.
14. Zhou YH, Chen Y, Y HU, L YU, Tran K, Giedzinski E, Ru N, Gau A, Pan F, Qiao J, Atkin N, Ly KC, Lee N, Siegel ER, Linskey ME, Wang P, Limoli C. The role of EGFR double minutes in modulating the response of malignant gliomas to radiotherapy. Oncotarget 2017;8:80853-68.
15. Klein A, Li N, Nicholson JM, McCormack AA, Graessmann A, Duesberg P. Transgenic oncogenes induce oncogene-independent cancers with individual karyotypes and phenotypes. Cancer Genet Cytogenet 2010;200:79-99.
16. Kops GJ, Weaver BA, Cleveland DW. On the road to cancer: aneuploidy and the mitotic checkpoint. Nat Rev Cancer 2005;5:773-85.
17. Nicholson JM, Cimini D. How mitotic errors contribute to karyotypic diversity in cancer. Adv Cancer Res 2011;112:43-75.
18. Geigl JB, Obenauf AC, Schwarzbraun T, Speicher MR. Defining 'chromosomal instability'. Trends Genet 2008;24:64-9.
19. Holland AJ, Cleveland DW. Losing balance: the origin and impact of aneuploidy in cancer. EMBO Rep 2012;13:501-14.
20. Zhu J, Pavelka N, Bradford WD, Rancati G, Li R. Karyotypic determinants of chromosome instability in aneuploid budding yeast. PLoS Genet 2012;8:e1002719.
22. Maley CC, Galipeau PC, Finley JC, Wongsurawat VJ, Li X, Sanchez CA, Paulson TG, Blount PL, Risques RA, Rabinovitch PS, Reid BJ. Genetic clonal diversity predicts progression to esophageal adenocarcinoma. Nat Genet 2006;38:468-73.
23. Li L, McCormack AA, Nicholson JM, Fabarius A, Hehlmann R, Sachs RK, Duesberg PH. Cancer-causing karyotypes: chromosomal equilibria between destabilizing aneuploidy and stabilizing selection for oncogenic function. Cancer Genet Cytogenet 2009;188:1-25.
24. Duesberg P, Mandrioli D, McCormack A, Nicholson JM. Is carcinogenesis a form of speciation? Cell Cycle 2011;10:2100-14.
25. Duesberg P, Stindl R, Hehlmann R. Origin of multidrug resistance in cells with and without multidrug resistance genes: chromosome reassortments catalyzed by aneuploidy. Proc Natl Acad Sci U S A 2001;98:11283-8.
26. Carter SL, Eklund AC, Kohane IS, Harris LN, Szallasi Z. A signature of chromosomal instability inferred from gene expression profiles predicts clinical outcome in multiple human cancers. Nat Genet 2006;38:1043-8.
27. Bakhoum SF, Danilova OV, Kaur P, Levy NB, Compton DA. Chromosomal instability substantiates poor prognosis in patients with diffuse large B-cell lymphoma. Clin Cancer Res 2011;17:7704-11.
28. Watanabe T, Kobunai T, Yamamoto Y, Matsuda K, Ishihara S, Nozawa K, Yamada H, Hayama T, Inoue E, Tamura J, Iinuma H, Akiyoshi T, Muto T. Chromosomal instability (CIN) phenotype, CIN high or CIN low, predicts survival for colorectal cancer. J Clin Oncol 2012;30:2256-64.
29. Lee AJ, Endesfelder D, Rowan AJ, Walther A, Birkbak NJ, Futreal PA, Downward J, Szallasi Z, Tomlinson IP, Howell M, Kschischo M, Swanton C. Chromosomal instability confers intrinsic multidrug resistance. Cancer Res 2011;71:1858-70.
30. Sansregret L, Vanhaesebroeck B, Swanton C. Determinants and clinical implications of chromosomal instability in cancer. Nat Rev Clin Oncol 2018;15:139-50.
31. Heng HH, Bremer SW, Stevens JB, Horne SD, Liu G, Abdallah BY, Ye KJ, Ye CJ. Chromosomal instability (CIN): what it is and why it is crucial to cancer evolution. Cancer Metastasis Rev 2013;32:325-40.
32. Hu Y, Ke C, Ru N, Chen Y, Yu L, Siegel ER, Linskey ME, Wang P, Zhou YH. Cell context-dependent dual effects of EFEMP1 stabilizes subpopulation equilibrium in responding to changes of in vivo growth environment. Oncotarget 2015;6:30762-72.
33. Chaturbedi A, Yu L, Linskey ME, Zhou YH. Detection of 1p19q deletion by real-time comparative quantitative PCR. Biomark Insights 2012;7:9-17.
34. Verhaak RG, Hoadley KA, Purdom E, Wang V, Qi Y, Wilkerson MD, Miller CR, Ding L, Golub T, Mesirov JP, Alexe G, Lawrence M, O'Kelly M, Tamayo P, Weir BA, Gabriel S, Winckler W, Gupta S, Jakkula L, Feiler HS, Hodgson JG, James CD, Sarkaria JN, Brennan C, Kahn A, Spellman PT, Wilson RK, Speed TP, Gray JW, Meyerson M, Getz G, Perou CM, Hayes DN. Integrated genomic analysis identifies clinically relevant subtypes of glioblastoma characterized by abnormalities in PDGFRA, IDH1, EGFR, and NF1. Cancer Cell 2010;17:98-110.
35. Ke C, Tran K, Chen Y, Di Donato A, Yu L, Hu Y, Linskey M, Wang P, Limoli C, Zhou Y. Linking differential radiation responses to glioma heterogeneity. Oncotagret 2014;5:1657-65.
36. Lecka-Czernik B, Lumpkin CK Jr, Goldstein S. An overexpressed gene transcript in senescent and quiescent human fibroblasts encoding a novel protein in the epidermal growth factor-like repeat family stimulates DNA synthesis. Mol Cell Biol 1995;15:120-8.
37. Zhou YH. EFEMP1 (EGF containing fibulin-like extracellular matrix protein 1). Atlas Genet Cytogenet Oncol Haematol 2013;17:115-20.
38. Rasheed BK, McLendon RE, Friedman HS, Friedman AH, Fuchs HE, Bigner DD, Bigner SH. Chromosome 10 deletion mapping in human gliomas: a common deletion region in 10q25. Oncogene 1995;10:2243-6.
39. Steck PA, Pershouse MA, Jasser SA, Yung WK, Lin H, Ligon AH, Langford LA, Baumgard ML, Hattier T, Davis T, Frye C, Hu R, Swedlund B, Teng DH, Tavtigian SV. Identification of a candidate tumour suppressor gene, MMAC1, at chromosome 10q23. 3 that is mutated in multiple advanced cancers. Nat Genet 1997;15:356-62.
40. Lopez-Gines C, Cerda-Nicolas M, Gil-Benso R, Pellin A, Lopez-Guerrero JA, Callaghan R, Benito R, Roldan P, Piquer J, Llacer J, Barbera J. Association of chromosome 7, chromosome 10 and EGFR gene amplification in glioblastoma multiforme. Clin Neuropathol 2005;24:209-18.
41. Coons SW, Johnson PC, Shapiro JR. Cytogenetic and flow cytometry DNA analysis of regional heterogeneity in a low grade human glioma. Cancer Res 1995;55:1569-77.
42. Wemmert S, Romeike BF, Ketter R, Steudel WI, Zang KD, Urbschat S. Intratumoral genetic heterogeneity in pilocytic astrocytomas revealed by CGH-analysis of microdissected tumor cells and FISH on tumor tissue sections. Int J Oncol 2006;28:353-60.
43. Gao C, Furge K, Koeman J, Dykema K, Su Y, Cutler ML, Werts A, Haak P, Vande Woude GF. Chromosome instability, chromosome transcriptome, and clonal evolution of tumor cell populations. Proc Natl Acad Sci U S A 2007;104:8995-9000.
Cite This Article
Export citation file: BibTeX | RIS
OAE Style
Zhou YH, Afrasiabi K, Linskey ME. Extracellular control of chromosomal instability and maintenance of intra-tumoral heterogeneity. J Cancer Metastasis Treat 2018;4:41. http://dx.doi.org/10.20517/2394-4722.2018.16
AMA Style
Zhou YH, Afrasiabi K, Linskey ME. Extracellular control of chromosomal instability and maintenance of intra-tumoral heterogeneity. Journal of Cancer Metastasis and Treatment. 2018; 4: 41. http://dx.doi.org/10.20517/2394-4722.2018.16
Chicago/Turabian Style
Zhou, Yi-Hong, Kambiz Afrasiabi, Mark E. Linskey. 2018. "Extracellular control of chromosomal instability and maintenance of intra-tumoral heterogeneity" Journal of Cancer Metastasis and Treatment. 4: 41. http://dx.doi.org/10.20517/2394-4722.2018.16
ACS Style
Zhou, Y.H.; Afrasiabi K.; Linskey ME. Extracellular control of chromosomal instability and maintenance of intra-tumoral heterogeneity. J. Cancer. Metastasis. Treat. 2018, 4, 41. http://dx.doi.org/10.20517/2394-4722.2018.16
About This Article
Special Issue
Copyright

Data & Comments
Data


 Cite This Article 10 clicks

 Like This Article 33
likes
Like This Article 33
likes


Comments
Comments must be written in English. Spam, offensive content, impersonation, and private information will not be permitted. If any comment is reported and identified as inappropriate content by OAE staff, the comment will be removed without notice. If you have any queries or need any help, please contact us at support@oaepublish.com.